
On the morning of June 5, 2026, the US government released its monthly jobs report. The numbers looked good. Really good. The economy added 172,000 jobs in May, more than double what economists had expected. Unemployment held steady. The labor market was described as “pretty darn solid.”
And then the stock market fell.
S&P 500 futures slid. Nasdaq dropped harder. Bond yields jumped. Within minutes of a positive economic headline, investors were selling. (Source: IBKR Campus – May Jobs Report)
If you are a beginner watching that play out, it looks completely backwards. Good news. Market goes down. What?
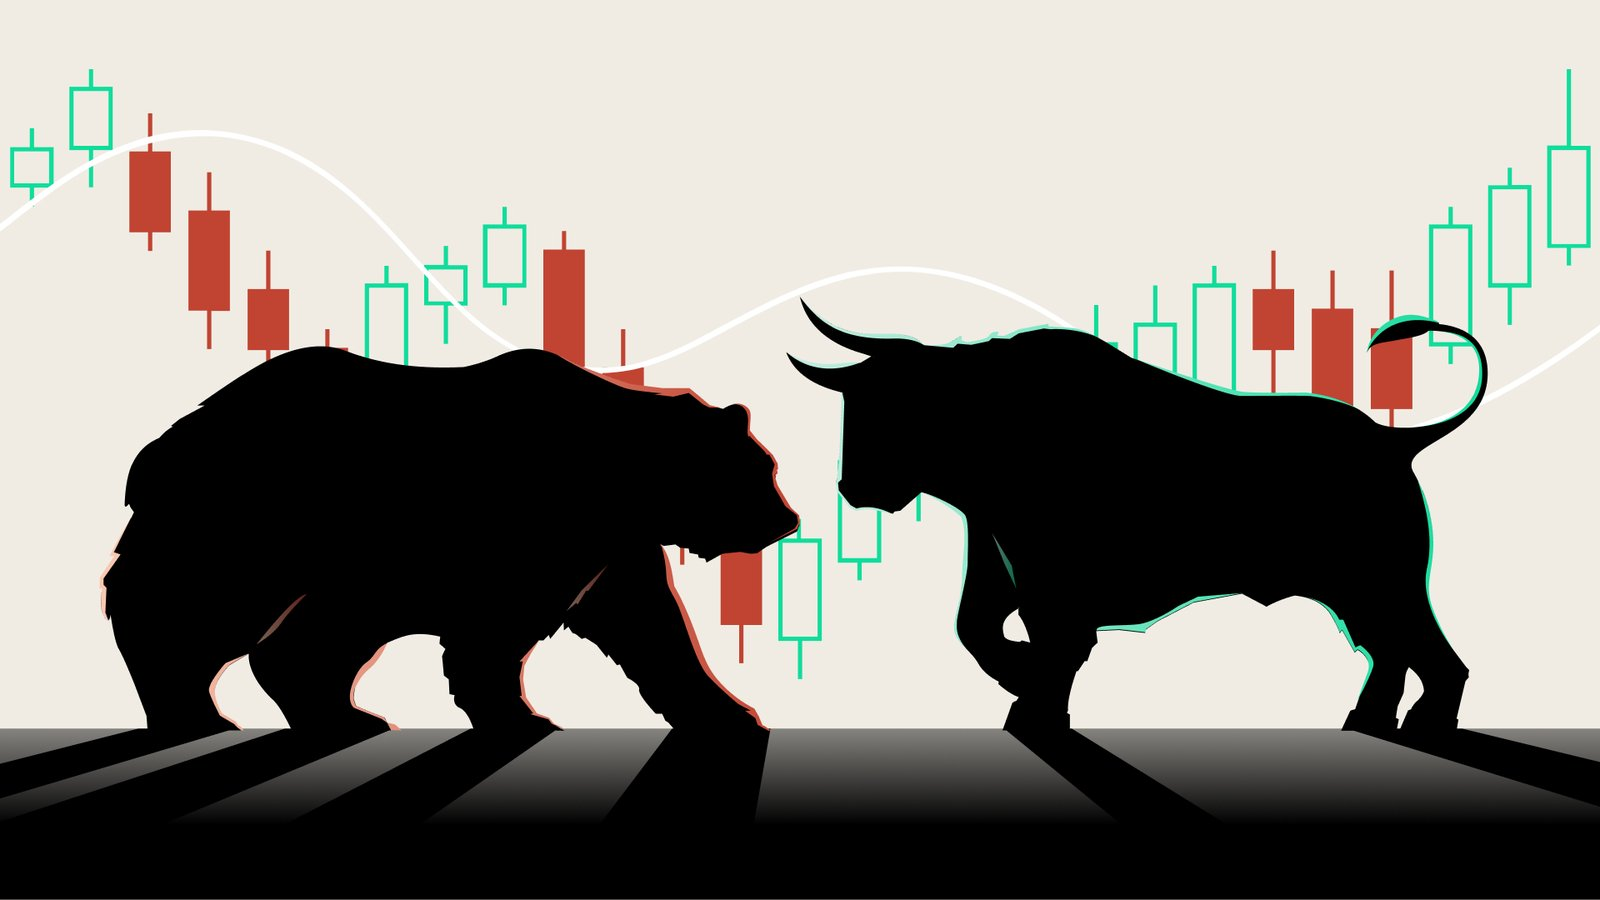
This article unpacks that apparent contradiction, and in doing so, explains two of the most important concepts in investing: bull markets and bear markets, and why understanding them matters far more than trying to react to them.
What Actually Happened on June 5
The jobs number came in at 172,000, more than double the 85,000 economists had forecast. That sounds like great news. And in some ways, it is. A strong labor market means people are employed, earning money, and spending.
But markets were not celebrating. Here is why.
The Federal Reserve, the US central bank, has two jobs. Its mandate is to keep inflation under control and to keep employment healthy. This is called the dual mandate. When the economy is too weak, the Fed cuts interest rates to stimulate growth. When the economy is too strong and inflation is a risk, the Fed raises rates to cool things down.
A blowout jobs number, especially arriving alongside already elevated inflation, signals to the market that the Fed has little reason to cut rates anytime soon. In fact, after the May report, the odds of a rate hike by December 2026 jumped to roughly 58%. (Source: IBKR Campus – May Jobs Report)
Higher rates make borrowing more expensive. They reduce the present value of future profits. They make bonds more attractive relative to stocks. So markets, which are always pricing the future and not the present, started adjusting immediately.
Good news about today. Bad news about what it means for tomorrow.
This is the “bad news is good news” dynamic that confuses beginners constantly. We will come back to it. But first, the fundamentals.
The Basic Definitions
What is a bull market?
A bull market is a sustained rise of 20% or more in a major stock index from a recent low. That 20% threshold is a market convention, not a law and not an official declaration. Nobody flips a switch and announces a bull market. It gets identified in hindsight using that benchmark.
Bull markets are the default state of stock markets. Historically, more time is spent in bull territory than bear territory. They feel normal because, over long enough timeframes, they are.
What is a bear market?
A bear market is a decline of 20% or more from a recent high, sustained over weeks or months. Same convention, opposite direction. Like bull markets, they are not declared in real time. You usually only know you were in one once the recovery has started.
The spectrum: from dip to crash
The 20% threshold matters because it separates a bear market from what comes before it. Here is the full picture:
| Decline from recent high | What it is called |
|---|---|
| Less than 5% | Normal volatility |
| 5 to 10% | A dip |
| 10 to 20% | A correction |
| 20% or more | A bear market |
| 40% or more | A severe bear / crash |
If you have read our article on stock market corrections, you already know the 10% zone well. Bear markets are simply what happens when a correction does not find a floor and keeps going.
What History Actually Tells Us
The US stock market has had 27 bear markets since 1928. That sounds like a lot. Until you do the math.
The average bear market lasts roughly 11 months. The average bull market that follows lasts about 4.3 years and returns approximately 150% from trough to peak. And bear markets, despite how they feel in the moment, have accounted for only about 38% of the total time studied. (Source: Walkner Condon – Bear Market History)
This is worth sitting with. For roughly two thirds of market history, stocks have been rising. The pain of bear markets is real, but the time spent in them is shorter than most people remember.
The most recent full cycle
The last bear market began in January 2022. The S&P 500 fell 25.4% from its peak, driven by the fastest inflation in 40 years and an aggressive rate-hiking campaign by the Federal Reserve. It bottomed in October 2022. By the Dow Jones definition, that low marked the start of a new bull market.
Since then, the S&P 500 has climbed roughly 92% from that October 2022 low. By historical standards, the current bull market is still relatively young. (Source: Yahoo Finance – Current Bull Market)
Secular vs cyclical: the two layers
You will sometimes hear about “secular” bull and bear markets alongside the regular ones. Here is the difference in plain English.
A secular trend is decades long. It is the tide. The US stock market has been in a secular bull market since roughly 2009. Within that, shorter cyclical swings happen, rises and falls that last months to a few years. The 2022 bear market was a cyclical bear inside a longer secular bull. Think of it like waves on an incoming tide: the waves go in and out, but the water level keeps rising.
Why Bear Markets Feel Worse Than They Are
Bear markets are psychologically brutal. Every day brings new headlines. The narrative always sounds like “this time is different.” The losses feel permanent in a way that gains never do.
There is a name for this: loss aversion. Humans feel the pain of a loss roughly twice as intensely as they feel the pleasure of an equivalent gain. This is not weakness. It is how we are wired.
But here is the statistic that should reframe everything.
42% of the S&P 500’s strongest single days over the last 20 years happened during bear markets. (Source: Walkner Condon – Bear Market History)
If you panic-sold during the bear market and missed even a handful of those recovery days, your long-run return is permanently damaged. The best days cluster right when things look worst, which is exactly when most investors are too scared to be in the market.
This is the trap we explored in depth in our buy high, sell low article. The investor who reacts to every bear market is the investor who consistently underperforms the one who does nothing.
Back to June 5: Why the “Bad News Is Good News” Dynamic Matters
The June jobs report is a perfect, real-time illustration of how financial markets actually work.
Most beginners assume markets go up when the economy is good and down when it is bad. That is roughly true over very long periods. But in the short run, markets are not reacting to the economy as it is. They are reacting to what the economy means for future policy and future profits.
Here is the logic chain that played out on June 5, in plain English:
| What happened | What it meant for markets |
|---|---|
| 172,000 jobs added, double the forecast | Economy is healthy. Labor market is resilient. |
| Fed has no reason to cut rates | Strong employment plus elevated inflation means the dual mandate does not call for easing. |
| Rate hike odds jumped to ~58% by December | Markets priced in a higher probability that borrowing becomes more expensive, not cheaper. |
| Growth stocks and Nasdaq fell hardest | Higher rates shrink the present value of future earnings. Tech and growth names feel it most. |
| Bond prices fell, yields rose | When rate hike expectations rise, existing bonds with lower fixed rates become less attractive. |
| The dollar strengthened | Higher expected rates attract capital from abroad, pushing the dollar up. |
The whole chain happened in minutes. Not because the economy got worse, but because the good news made future tightening more likely.
Understanding this is not about trying to trade around jobs reports. It is about not being surprised or alarmed when you see this pattern. The market is not broken. It is doing exactly what it is designed to do: price expectations, not headlines.
What Should You Actually Do?
During a bull market
The temptation in a bull market is complacency. Everything is going up, so everything feels fine. But bull markets are often when concentration risk builds quietly, a portfolio that has drifted heavily toward one sector or style without you noticing.
The job during a bull market is not to celebrate. It is to stay diversified and rebalance if your allocation has drifted significantly. Our rebalancing article covers how to do this without overthinking it.
During a bear market
Do not panic sell. We know. Easier said than done. But the math is unambiguous: selling during a bear market locks in losses and takes you out of the market for the recovery days that follow.
If you are in the accumulation phase of life, still saving and investing regularly, a bear market is not a crisis. It is a sale. Dollar-cost averaging turns a falling market into a structural advantage: every monthly contribution buys more shares at lower prices.
If you are close to retirement and genuinely cannot absorb the volatility, that is a portfolio construction question, not a reason to sell in a panic. The time to adjust risk is before the bear, not during it.
The one thing that matters most
The investor who performs best across a full market cycle is almost never the one who reacted most. It is the one who had a plan, held to it, and kept investing through both ends of the cycle. Time in the market has consistently beaten timing the market.
Try It Yourself: The Zorroh Portfolio Analyzer
Want to see how different portfolios held up through the 2022 bear market and how they recovered? Run this comparison in the Zorroh Portfolio Analyzer:
| Portfolio | Holdings | What it represents |
|---|---|---|
| Portfolio 1: Stay invested | SPY (100%) | Pure equity, no defensive positioning |
| Portfolio 2: Defensive blend | SPY (60%) / AGG (40%) | Classic stock and bond balance |
| Portfolio 3: Bear-aware tilt | SPY (50%) / GLD (25%) / AGG (25%) | Adds gold as an additional hedge |
Set the date range to 2015 to 2026, rebalancing quarterly. Then look at:
- Max Drawdown: how much did each portfolio lose in 2022?
- CAGR: did the defensive positioning actually improve long-run returns, or did it just reduce short-term pain?
- Sharpe Ratio: which portfolio delivered the best return per unit of risk?
- Calendar Year Heatmap: see 2022 side by side across all three
The answer is rarely what people expect.
The Takeaway
Bull and bear markets are not anomalies. They are the system. The cycle repeats, not on a schedule, not predictably, but reliably over time. Since 1928, every bear market in US history has eventually been followed by a new bull market that set fresh highs.
Understanding what bull and bear markets are removes most of the fear. You know that a 25% decline is painful but historically temporary. You know that a jobs report can push markets down even when the economy is strong. You know that the best recovery days happen when things look worst.
The job of a long-term investor is not to predict which comes next. It is to build a portfolio that can survive the bear and stay invested long enough to participate in the bull.
For more on the risks that show up across full market cycles, see our guide to investment risk for beginners.
Disclaimer:
The content on this blog (Zorroh) is provided for general informational and educational purposes only. It is not intended as investment, financial, tax, legal, or other professional advice. Past performance is not indicative of future results. Investing involves risk, including possible loss of principal. Always conduct your own research or consult a qualified professional before making investment decisions.